Trinidad and Tobago Dryness/Drought Indicator, Monitor and Outlook By End of March 2024
ISSUED AT: 02:43 PM
Date: Friday 15th of March 2024
Dryness Indicator for December to February 2024 & 3-month Dryness Outlook for March to May 2024
Key Message:
In general, most of Trinidad and Tobago received below-normal rainfall during December-January-February. Piarco’s monthly totals were 115.9 mm, 48.1 mm and 3.5 mm while Tobago’s monthly totals were 53.4 mm, 49.0 mm and 3.9 mm. The 3-month dryness levels across the country was observed to be Borderline-Dry to Very-Dry. The outlook for the next three months, March-April-May 2024 shows all areas are likely to improve and be free of abnormal dryness in the short-term.
Trinidad and Tobago Dry/Wet Spell Monitor and Outlook by End of March 2024
ISSUED AT: 02:43 PM
Date: Friday 15th of March 2024
Dryness Indicator for December to February 2024 & 3-month Dryness Outlook for March to May 2024
Key Message:
In general, most of Trinidad and Tobago received below-normal rainfall during December-January-February. Piarco’s monthly totals were 115.9 mm, 48.1 mm and 3.5 mm while Tobago’s monthly totals were 53.4 mm, 49.0 mm and 3.9 mm. The 3-month dryness levels across the country was observed to be Borderline-Dry to Very-Dry. The outlook for the next three months, March-April-May 2024 shows all areas are likely to improve and be free of abnormal dryness in the short-term.
Dryness Indicator for December to February 2024
During December 2023, mix days occurred, with light to moderate rainfall over the islands, more so Trinidad than Tobago. Four wet days (>10.0 mm) were recorded in Trinidad while one wet day was recorded in Tobago. A continuation of mixed days in January occurred, with one wet day (>10.0 mm) in Trinidad and one wet day (>10.0 mm) in Tobago, most of the month experienced relatively wet days (<10.0 mm). At the end of January beginning of February very dry conditions were entrenched over both islands, where many dry days occurred. Both Piarco and Crown Point stations recorded twenty-eight dry days (< 1.0 mm).
The 3-month dryness indicator for December to February shows dryness indicator values that ranged from -1.5 to -0.045, which is within Very-Dry to Borderline-Dry conditions (see Figure 1).
The colour-coded dryness indicator map showing observed level of dryness is based solely on rainfall and can be used for decision making or for heightening awareness on dryness.
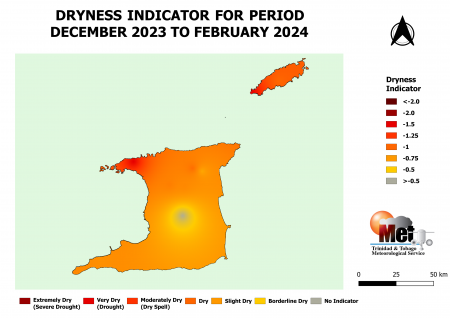
Figure 1. The colours on this map show the predicted levels of dryness for the period March to May 2024. It is based on the difference between standardized accumulated rainfall (observed and predicted) from March to May 2024 and the historical average rainfall for the same period. The yellow to red colours indicate borderline dry to extremely dry levels. The grey colour indicates areas where there is no significant dryness concerns.
Dryness Outlook for March to May 2024:
Wetter conditions are expected in late March and continued in April and May, where frequent showers are expected. The predicted volume of rainfall in late March-April-May 2024 are likely to replenish soil moisture. An early start to the Rainy season is expected in the second half of May 2024. The Dryness Outlook shows dryness indicator values between -0.07 and -0.05 are likely to develop across the vast majority of Trinidad and Tobago by the end of May (see Figure 2). The outlook is based solely on rainfall and should be used only as a guidance tool.
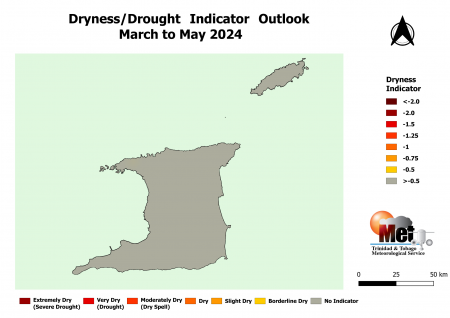
Figure 2. The colours on this map show the predicted levels of dryness for the period March to May 2024. It is based on the difference between standardized accumulated rainfall (observed and predicted) from March to May 2024 and the historical average rainfall for the same period. The yellow to red colours indicate borderline dry to extremely dry levels. The grey colour indicates areas where there is no significant dryness concerns.
Standardized Precipitation Index
The Standardized Precipitation Index (SPI) is an index showing the severity and rarity of dryness or wetness of an area. Negative values of SPI indicate less than median rainfall and drier conditions; positive values indicate greater than median rainfall and wetter conditions. In general, dryness impacts are expected when the value of the 3-month SPI lies near -1.0. As the negative SPI value becomes larger in amount than -1.0, the severity of impacts increases. For Trinidad and Tobago, extreme dryness occurs in the dry season when negative SPIs are larger than -1.25.