Trinidad and Tobago Dryness/Drought Indicator, Monitor and Outlook By End of June 2024
ISSUED AT: 01:53 PM
Date: Thursday 27th of June 2024


Dryness Indicator for March to May 2024 & 3-month Dryness Outlook for June to August 2024
Key Message:
In general, Trinidad and Tobago received mixed rainfall amounts for the period March to May 2024. Trinidad received below-normal rainfall in the months of March and May; and above-normal rainfall in the month of April. The rainfall totals for March, April and May consecutively are 17.0 mm, 58.7 mm and 39.1mm. Tobago received above-normal rainfall in March-April, followed by below-normal monthly totals in May. The rainfall totals for March, April and May consecutively are as follows 93.0 mm, 56.1 mm and 45.5 mm....
Trinidad and Tobago Dry/Wet Spell Monitor and Outlook by End of June 2024
ISSUED AT: 01:53 PM
Date: Thursday 27th of June 2024
Dryness Indicator for March to May 2024 & 3-month Dryness Outlook for June to August 2024
Key Message:
In general, Trinidad and Tobago received mixed rainfall amounts for the period March to May 2024. Trinidad received below-normal rainfall in the months of March and May; and above-normal rainfall in the month of April. The rainfall totals for March, April and May consecutively are 17.0 mm, 58.7 mm and 39.1mm. Tobago received above-normal rainfall in March-April, followed by below-normal monthly totals in May. The rainfall totals for March, April and May consecutively are as follows 93.0 mm, 56.1 mm and 45.5 mm. The 3-month dryness levels across the country were borderline dryness to no concern. The outlook for the next three months, June-July-August 2024 shows all areas are likely to improve and be free of dryness in the short-term.
Dryness Indicator for March to May 2024
In March, a continuation of dry conditions occurred in Trinidad while Tobago had heavy rainfall events during the first quarter of the month. Trinidad had five relatively wet days (<10.0 mm) and rest of month were a mixture of relatively dry days (< 1.0 mm) and dry days (0.0 mm). Tobago had two wet days (>10.0 mm), six relatively wet days (<10.0 mm), and the rest of days were a mixture of relatively dry days (< 1.0 mm) and dry days (0.0 mm).
In April, Trinidad had two wet days (>10.0 mm) at the beginning of the month followed by two relatively wet days (<10.0 mm) and a mixture of relatively dry days (< 1.0 mm) and dry days (0.0 mm) for the rest of the month. Similarly, Tobago had two wet days (>10.0 mm) at the middle of the month and four relatively wet days (<10.0 mm); while the rest of the month was a mixture of relatively dry days (< 1.0 mm) and dry days (0.0 mm). A return to dry conditions occurred in May, Trinidad had one wet days (>10.0 mm), five relatively wet days (<10.0 mm), and the rest of month were a mixture of relatively dry days (< 1.0 mm) and dry days (0.0 mm). Tobago had two wet days (>10.0 mm), three relatively wet days (<10.0 mm), and the rest of month were a mixture of relatively dry days (< 1.0 mm) and dry days (0.0 mm).
The 3-month dryness indicator for March to May shows dryness indicator values that ranged from -0.64 to +0.29, which is within borderline-dry to no concern category (see Figure 1).
The colour-coded dryness indicator map showing observed level of dryness is based solely on rainfall and can be used for decision making or for heightening awareness on dryness.
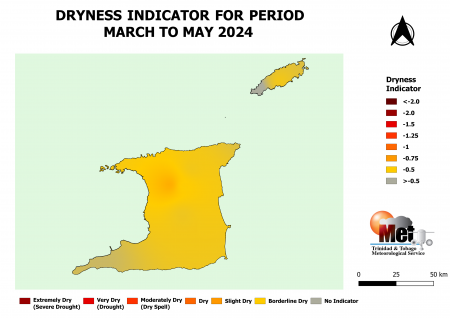
Figure 1. The colours on this map show observed dryness levels based on the rainfall differences from average, which have been standardized and expressed as the number of standard deviations less than average. The period used to compute the dryness is the 3-month period March to May 2024 compared to the historical average for the same 3-month period. The yellow to red colours on the map are used to indicate areas with borderline-dry to extremely-dry levels of dryness. The grey colour indicates areas where there is no significant dryness concerns.
Dryness Outlook for June to August 2024:
Although a continuation of frequent wet conditions are expected in June-July-August with showers and thundershowers the presence of dust haze and associated dry air at times will reduce/stymie the rainfall intensity and amount. The predicted volume of rainfall in June-July-August 2024 are likely to replenish soil moisture and will raise streams and river levels. It will also go towards refilling catchment areas and reservoirs. The Dryness Outlook shows dryness indicator values between +0.028 and +0.316 are likely to develop across the vast majority of Trinidad and Tobago by the end of August (see Figure 2). The outlook is based solely on rainfall and should be used only as a guidance tool.
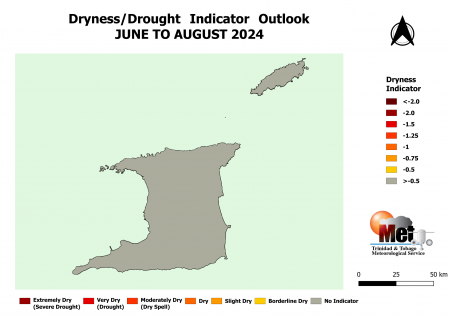
Figure 2. The colours on this map show the predicted levels of dryness for the June to August 2024. It is based on the difference between standardized accumulated rainfall (observed and predicted) from June to August 2024 and the historical average rainfall for the same period. The yellow to red colours indicate borderline dry to extremely dry levels. The grey colour indicates areas where there is no significant dryness concerns.
Standardized Precipitation Index
The Standardized Precipitation Index (SPI) is an index showing the severity and rarity of dryness or wetness of an area. Negative values of SPI indicate less than median rainfall and drier conditions; positive values indicate greater than median rainfall and wetter conditions. In general, dryness impacts are expected when the value of the 3-month SPI lies near -1.0. As the negative SPI value becomes larger in amount than -1.0, the severity of impacts increases. For Trinidad and Tobago, extreme dryness occurs in the dry season when negative SPIs are larger than -1.25.