Rainfall and Temperature Outlook for Trinidad and Tobago, Wet Season 2025
ISSUED AT: 10:32 AM
Date: Monday 2nd of June 2025

Key Messages
Likely Impacts An outlook with increased chances for wet as usual conditions suggests:
Rainfall and Temperature Outlook for Trinidad and Tobago, Wet Season 2025
ISSUED AT: 10:32 AM
Date: Monday 2nd of June 2025
2025 Wet Season is Likely to be Near Normal. Flood Potential remains
Moderate to High.
Key Messages
- The 2025 Wet Season (June-December) is most likely to be wet as usual in Trinidad and Tobago. The potential for flooding is expected to be normal to moderately higher than normal.
- Near normal rainfall means that Trinidad and Tobago will receive between 75% to 125% of the climatological normal.
- Below normal number of heavy rainfall days (>=10.0 mm) and extremely heavy rainfall days (>=50.0 mm) are likely.
- Normal number of 3_day wet spells (>=10.0 mm) and Below Normal number of 5_day wet spells (>=10.0 mm).
- Flood potential is moderately higher than normal for known flood-prone areas and near normal for emerging flood-prone areas. Citizens are urged to accelerate preparations.
- Both day and night temperatures are expected to be warmer than average, especially over western parts of Trinidad and Tobago.
- Moderate chances for maximum temperatures to reach and exceed 34.0 C during the season. Chances are highest during the months of August to October.
Likely Impacts
An outlook with increased chances for wet as usual conditions suggests:
- Moderate risk of heavy rainfall days and prolonged wet periods.
- Heightened concerns exist for persons in occasionally flooded and flood-prone areas.
- Hotter than average maximum day and night temperatures especially in western urban areas of Trinidad and Tobago.
- Heightened concerns for persons with heat-sensitive ailments, vulnerable persons exposed to excessive heat, heat stress in livestock and other animals, as well as, in young and/or transplanted crops.
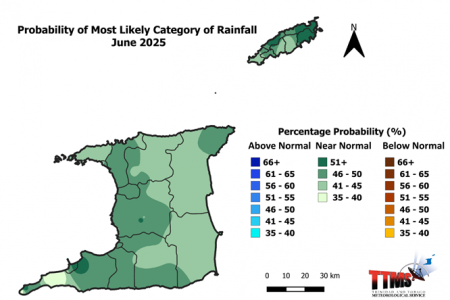
Figure 1: Category of rainfall likely for June 2025 with the highest chance of occurrence expressed as probabilities represented on the map. Blue areas indicate places with an increased chance for above-normal rainfall, brown areas show an increased chance for below-normal rainfall, while green areas show an increased chance for near-normal rainfall. Normal is defined by the rainfall that was observed in the middle one-third of the June period rainfall totals during the historical period used to produce the outlook.
- June is expected to have near normal rainfall totals.

Figure 2: Category of rainfall likely for June to August 2025 (JJA) with highest chances of occurrence expressed as probabilities represented on the map. Blue areas indicate places with an increased chance for above-normal rainfall, brown areas show an increased chance for below-normal rainfall, while green areas show an increased chance for near-normal rainfall. Normal is defined by the rainfall that was observed in the middle one-third of the JJA period rainfall totals during the historical period used to produce the outlook.
- The first half of the wet season, June, July and August (JJA) is likely to be wet as usual in Trinidad and Tobago.
- Most areas have greater than 40% chance for near normal rainfall totals.

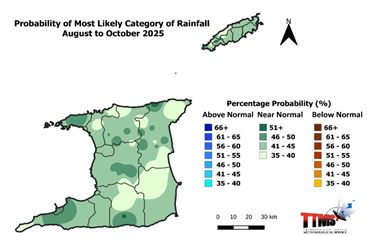
Figure 3: Category of rainfall likely for June, July and August 2025 (JJA) and August, September and October 2025 (ASO) with the highest chance of occurrence expressed as probabilities and colour coded on the map. Blue areas indicate that it is more likely for above-normal rainfall to occur than for below-normal or near-normal. Brown areas indicate that it is more likely for below-normal rainfall, while green areas indicate that it is more likely for near-normal rainfall. Normal is defined by the rainfall that was observed in the middle one-third of the JJA and ASO period rainfall totals during the historical period used to produce the outlook.
- The three months seasons of July to September, August to October and September to November are likely to get near normal rainfall totals.

Figure 4: Category of rainfall likely for September, October and November 2025 (SON) with the highest chance of occurrence expressed as probabilities and is colour coded on the map. Blue areas indicate that it is more likely for above-normal rainfall to occur than for below-normal or near-normal. Brown areas indicate that it is more likely for below-normal rainfall, while green areas indicate that it is more likely for near-normal rainfall. Normal is defined by the rainfall that was observed in the middle one-third of the SON period rainfall totals during the historical period used to produce the outlook.
- The outlook indicates a moderate probability (20%-52%) exists that the September to November (SON) rainfall totals will be near normal.

Figure 5. Category of rainfall most likely for the Wet Season 2025 with the highest chance of occurrence expressed as probabilities and colour coded on the map. Blue areas indicate that it is more likely for above- normal rainfall to occur than for below-normal or near-normal. Brown areas indicate that it is more likely for below-normal rainfall; while green areas indicate that it is more likely for near-normal rainfall. Normal is defined by the rainfall that was observed in the middle one-third of June to December rainfall totals during the historical period used to produce the outlook.
- Overall, the 2025 wet season is likely to be near normal.
- There is a 62% chance for below-normal number of heavy rainfall days (days with rainfall equal to or exceeding 25 mm). The country is likely to get 8 to 13 heavy rainfall days during the season, the long term average being 16 heavy rainfall days.
- A 52% chance exists for normal, extremely heavy rainfall days. These are likely to be days with rainfall reaching or exceeding 50.0 mm.
- The country is likely to get 1 to 3 heavy rainfall days during the season with at least 5 days likely to produce over 3 inches or 75 mm of rainfall. The long term average being 4 heavy rainfall days.
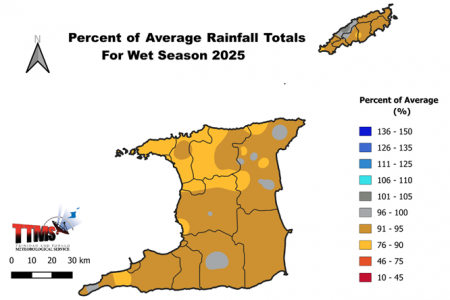
Figure 6: Percentage of Average Totals during the Wet season.
- The Outlook shows the highest percent of average totals to be around 103%.
- Most areas are likely to get rainfall totals that range between 80% and 103% of long term average (1991-2020).

Figure 7: Possible accumulated rainfall totals with the highest chance of occurring during the 2025 wet season.
- Possible rainfall volumes for the 2025 wet season are likely to between 900 mm to 2100 mm with the maximum occurring in eastern and northeastern Trinidad, in the vicinity of Cumaca, Sangre Grande, Vega De Oroupche, Plum Mitan and environs.
- In Tobago rainfall volumes will range between 1030 mm to 1580 mm with the maximum occurring in areas of Mount St. George, Goodwood and environs.
- There is a 46% chance of normal number of 3_day wet spells. Normally, the country receives five (5) 3_day wet spells of rainfall greater than or equal to 10.0 mm over the entire season.
- There is also a 42 % chance of below-normal 5_day wet spells. The country will likely receive one (1) 5_day wet spell, down from the average of two (2).
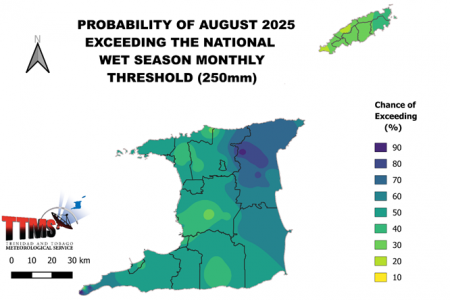
Figure 8: Chance of exceeding 250 mm of rainfall during August 2025.
- The forecast shows that there is a 10% to 86% chance of reaching and exceeding 250 mm during August 2025, which is more than the average for the month in most areas of Trinidad and Tobago.
- The Outlook shows that Cumaca and environs have the highest chance for rainfall to exceed 250 mm in August 2025.
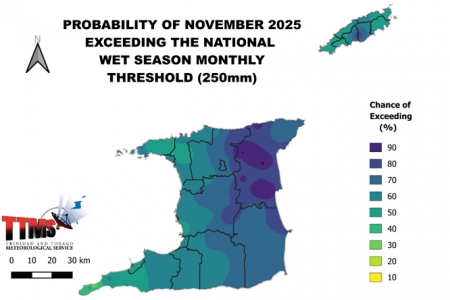
Figure 9: Chance of exceeding 250 mm of rainfall during November 2025.
- The chance of exceeding 250 mm of rainfall during November, the wettest month of the year, is moderate to high.
- The Outlook shows a 20% to 91% chance for November’s rainfall to reach or exceed 250 mm, across northeastern areas of Trinidad, which is usually the wettest part of the Trinidad.
- The Outlook also shows a 40% to 73% chance that Tobago may exceed 250 mm of rainfall in areas of Mount St George, Goodwood and environs.
Seasonal Flood Potential Outlook:
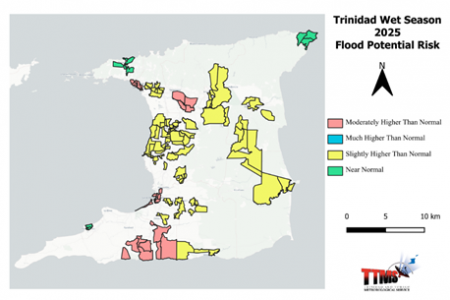
Figure 10 a
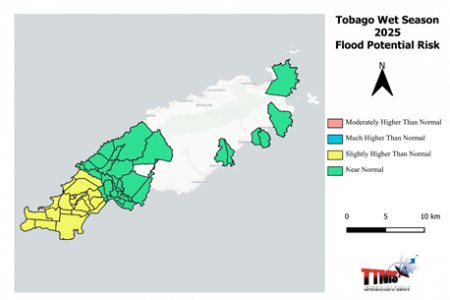
Figure 10 b
Figures 10 a and 10 b: The 2025 Wet Season Flood Risk Potential Outlook with categories of flood potential colour-coded on the map. Blue indicates a much higher than normal flood potential. Brown indicates it is more likely for moderately higher normal flood potential. Yellow indicates a slightly higher than-normal flood potential. Green indicates a near-normal flood potential.
Seasonal Flood Potential Outlook:
- There is a much elevated flood potential, with moderately higher than normal flood potential in northern Trinidad, near St Helena, Piarco, Tunapuna and environs, Port of Spain and environs and San Fernando. Similar elevated potentials exist in the South Oropouche River Basin, Penal, Debe, Siparia, Moruga and environs.
- Flood potential risk is slightly higher than normal, Plum Mitan and environs, Arima, La Horquetta and environs, Sangre Grande and parts of Manzanilla, Mayaro and environs.
- In the island of Tobago, slightly higher than normal potential exist in Scarborough, Crown Point and environs.
- The north western parts of Trinidad, Diego Martin and north eastern parts of Toco and the rest of Tobago has a near normal flood risk potential.
Mean Temperature Outlook for Trinidad and Tobago
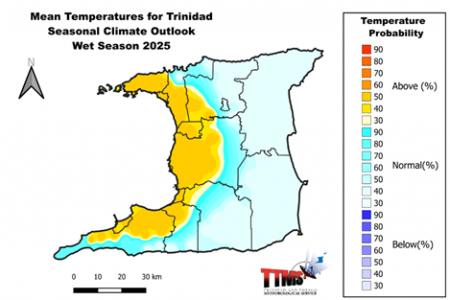
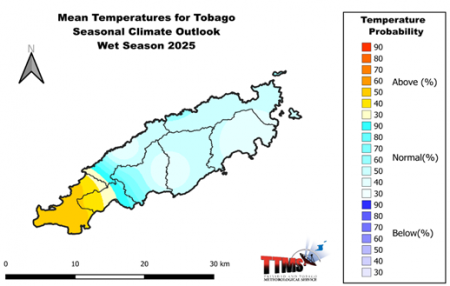
Figure 11: The map shows the colour-coded category (below-normal, above-normal, and near-normal) of mean temperatures that are most likely to occur across Trinidad and Tobago for the Wet Season 2025. The colour-coded bar-graph with the numbers to the right gives the likelihood for each forecast category to occur.
- The 2025 wet season temperature outlook favours warmer than average temperatures, particularly in western areas. There is a greater than 45% chance for maximum day temperatures and minimum night temperatures to be above normal.
- The excessive heat season usually peaks during August to October. There are elevated chances for maximum temperatures to reach or exceed 34.0 oC during the season.
- Chances are also elevated for 5-day short-duration hot spells and 3-day heat surges (maximum temperatures to reach or exceed 34.0 oC to develop during August to October.
- Cities and urban areas have the highest chance for warmer than average temperatures and are likely to get the most intense heat, with temperatures likely to reach or exceed 34.0 oC.
Likely Implications:
- Wet as usual conditions in the first half of the rainy season with heavy rainfall days that are moderately high flood potential risk. Flash flood risk remains elevated in occasional and well-known flood-prone areas;
- A moderate likelihood for near normal rainfall during the 2025 wet season suggests moderately high chances for flood-risks in flood-prone areas;
- Localized moderate to heavy rainfall days and wet spells could trigger flash-flooding in high-risk/flood-prone areas, within watersheds with narrow valleys and steep hill-sides;
- Expect an increase in recharge rates, surface water flows and river levels;
- Possible increased turbidity and degraded water quality on heavy rainfall days;
- Regular rainfall events will serve the agriculture sector but the excess rainfall can lead to waterlogging of agricultural fields, which can negatively affect crops;
- Increased rainfall, mixed with warm and humid conditions tends to promote the rapid multiplication of some agricultural pests, diseases and fungal growth;
- Increased rainfall could lead to reduced traffic flows, disruptions in localized travel and longer travel times, which may require earlier commute start times;
- An increase in surface water ponding can promote mosquito breeding, which can lead to an increase in vector-borne diseases;
- Extreme temperatures can lead to relatively excessive heat for Trinidad and Tobago during the peak of the local heat season, which can amplify existing and worsen chronic health conditions in vulnerable persons;
- The need to access cooling machines during hot spells may result in higher electricity bills.
- Hot days and spells can cause heat stress in livestock and wilting in newly transplanted and younger crops;
- Warmer than usual temperatures can lead to warmer than usual water temperatures, which are particularly important for the health of aquaponic fishes and plants;
Sectorial Early Actions and Preparedness That Can Be Taken To Reduce Possible Impact
General Public
- Strengthen community coordination with disaster management personnel;
- Persons living in flood-risk areas should quicken their flood planning and preparedness efforts;
- Purchase emergency supplies, pack a grab and go-bag with clothes and essentials and have these on standby;
- Get acquainted with your flood-prone areas, shelter locations and become sand-bag ready;
- Develop an evacuation plan that outlines the safety of family members and pets;
- Update contact information for the local disaster officials and other emergency services.
Disaster Risk Management Sector
- Put in place the necessary measures to ensure communities are sensitized;
- Start preparedness for the expected increase in rainfall and the associated negative impacts;
- Review contingency plans and early warning information dissemination channels;
- Revisit and review emergency plans and communication strategies;
- Refresh media training and distribute appropriate advice on the outlook through the media.
Water and Energy sector
- Update flood action plans and continue water conservation awareness messaging;
- Revisit contingency plans and ramp up de-silting of major rivers and reservoirs;
- Remove dry branches and tree overhangs near electrical wires, especially in landslip-prone areas.
Drainage & Infrastructure
- Ramp-up de-silting and cleaning of drainage systems, water channels, outlets and river mouths;
- Pay attention to areas of rock fall which may be indicative of potential future landslides.
Agriculture & Food Security Sector
- Raise awareness on agriculture, pest and disease control measures. Revisit flood action plans.
Waste Management Sector
- Review contingency plans and operational practices (such as diverting rainfall water-flows away from waste heaps) used for preventing leaching and contamination of ground/surface water.
Health Sector
- Revisit contingency plans to manage spikes in vector-borne and excessive heat ailments;
- Review the fumigation plan and programme.
Be vigilant and visit the Met. Service website at www.metoffice.gov.tt regularly and follow us on social media to keep up to date. Download our mobile app on Google Play Store or Apple iStore.
Climatic Influencers and Context of the Outlook:
- Currently, sea surface temperatures (SSTs) in waters east of Trinidad and Tobago and to the West Coast of Africa (Area of Interest) are in most part above normal.
- An ENSO Neutral conditions exists in the central-eastern equatorial Pacific Ocean. Over the last month sea surface temperatures remained average.
- The north/south sea surface temperature gradients, well known as the Atlantic Meridional Mode (AMM), which is a key facilitator of local rainfall during the season is currently in neutral mode. A tongue of warm water exist along the coastal areas of east Trinidad, Guianas and northern Brazil. There is a moderate probability (65%) that the ITCZ as well as cloud convergence bands and southeasterly low level moist wind flow will frequently visit, more so Trinidad, than Tobago. Later in the season it is likely to transition into a positive AMM mode in August, September and October (ASO) 2025.
- The North Atlantic Oscillation (NAO) has alternated between phases since April 2025 and is forecast to move to a weak positive phase in June 2025, having a small negative influence on rainfall.
- The Madden Julian Oscillation (MJO) is incoherent at this time, there is moderate probability that Kelvin and/or Rosby waves may have a positive influence in rainfall over the eastern Caribbean during the months of June to August 2025.